Spectrum Table
A widget that allows plotting a spectrum attribute in a table.
The widget shows a table coming from spectrum attributes.
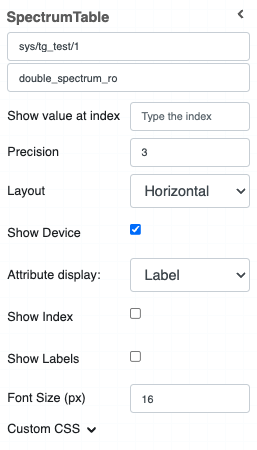
Widget setting
The user has the ability to:
Select the device and the spectrum attribute to plot in the table
Precision: the precision to show for each value in the table
Layout: the user can select the table layout: horizontal or vertical
Show device: if selected, show the device name
Attribute Display: select if show the name or the label of the device in the title. Label is shown as default
Show index: if selected, it shows the index (0,1,2,3…) in the table header
Show index: if selected, it shows the Labels (Index: , Values, ) in the first column of the table
Customize the CSS of the widget
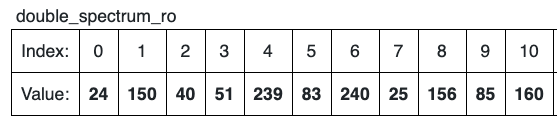
Widget design
Once plotted, the result is like the following image:
Notice: the map legend is shown on the right *