Taranta errors and warnings handling
Taranta has a common place to store temporarily the current errors/warnings from the current user section. This way the user can consult/share them in an easier manner
Example of error count reporting:
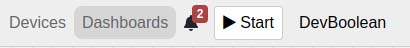
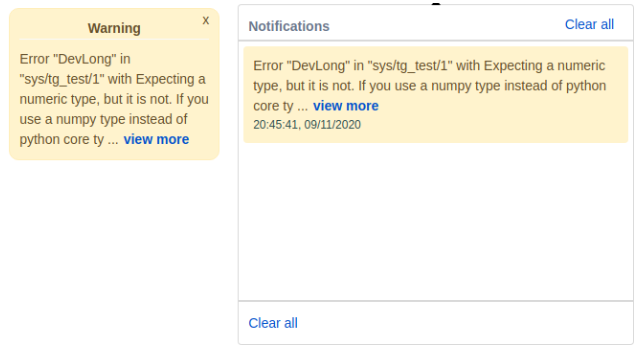
It is possible to identify the number of current error & warnings just by looking at the top left bell icon:
When the icon is clicked taranta will display all the errors from the current user session:
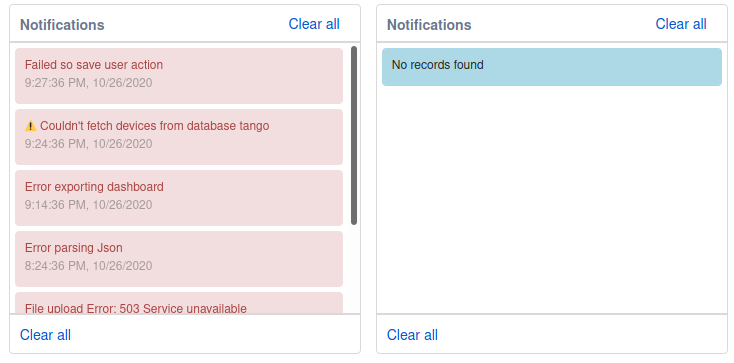
Once user has gone through the error & warnings he can clear the list by clicking “Clear all” button.
As a developer if one wants to trigger new notification the RunCanvas redux/sagas implementation should be followed:
import
{ saveNotification }from shared/user/state/actionCreators;construct you message something like
const notification: Notification = {
username: currentUserName, level: NotificationLevel.WARNING, message: message,timestamp: Date.now().toString()};
3. trigger the message with this.props.onSaveNotification(notification,currentUserName);
*. In order to use redux/sagas the component needs to be connected whith mapDispatchToProps
An enum as been created called NotificationLevel in order to help to define the level of the feedback it can be:
UNDEFINED = "Undefined"
ERROR = "Error"
WARNING = "Warning"
INFO = "Info"
They display as follows:
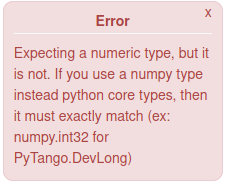
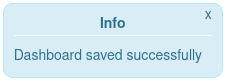
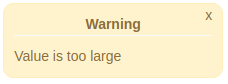
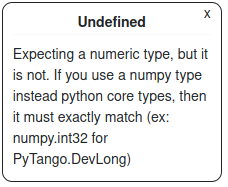
In the case of INFO notification, the message disappears after 5 seconds. The other notifications remain until the user clicks the ‘x’ button.
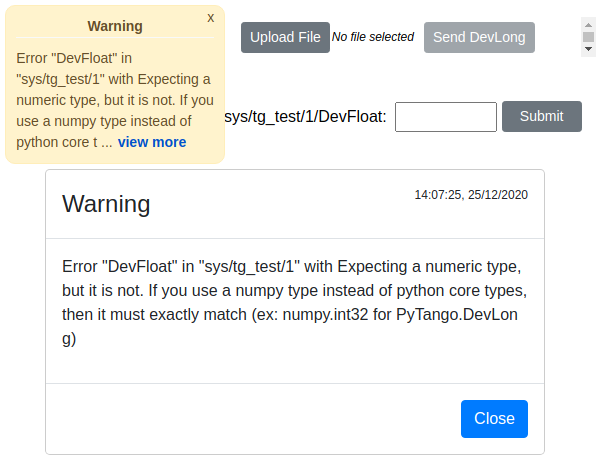
When notification message(error, warning or info) is long, it is trimmed to 130 character with “expand” button
By clicking on expand button user can view entire message in a popup dialog as below. Background of Popup dialog is transparent and can be dragged/moved to view main screen/dashboard content.
Errors on widgets in dashboard
When adding a widget in dashboard, if not configured properly a warning is shown on top of widget as below:
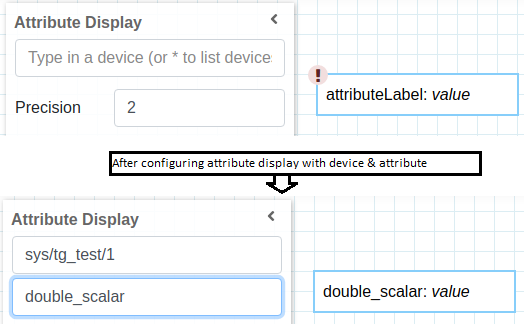
In above attribute display widget, device & attribute is not configured hence warning is shown, after configuring device & attribute warning icon disappears
Similarly if we a widget is configured with missing / deleted dashboard variable, a warning message is shown as below:
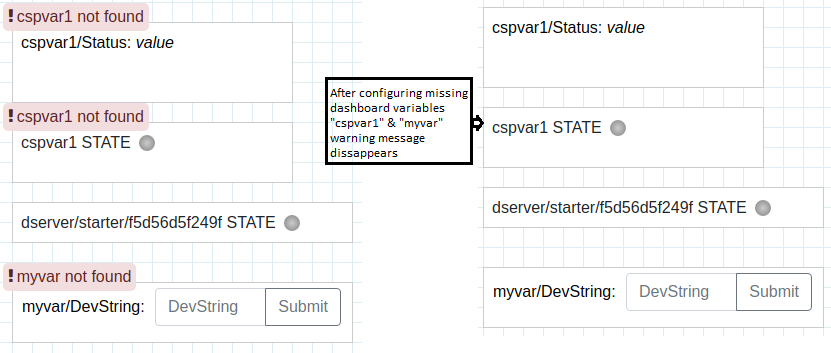
This warning message on widget is resolved by adding missing dashboard variable from configuration button
*Note: Start button on dashboard is enabled only if there are no warning on dashboard